SYSTEMS OF REPRESENTATION
< RFC >
To be able to think and communicate current life-or-death topics has exceeded the descriptive reach of common language. A combination of capital-controlled manipulative media, a culture of self-interest with short-term arithmetic, advertising-powered capitalism, and yet still somewhat democratic control of politics, leads to unacceptable outcomes.
This is a open-to-add list of powerful representation systems, that might as such have power to inform & influence beliefs. Curated by @dcht00 and @chtotalism.
Table of Contents
¶ Thoughtspace
middlemachine/David Potocnik, ~10.000 nodes, http://middlemachine.com (2011)
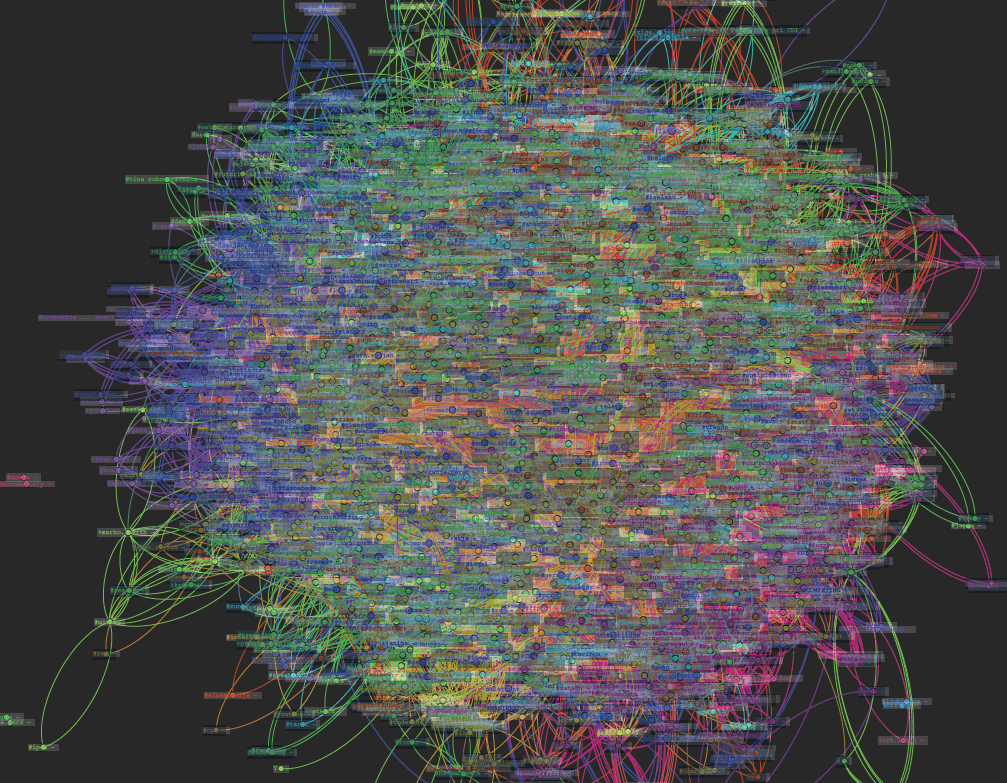
aka "connectomes"
aka "neuro-maps"
middlemachine/David Potocnik, ~10.000 nodes, http://middlemachine.com (2011)
aka "connectomes"
aka "neuro-maps"
¶ Fact Checking
(http://www.politifact.com, example Trump's Truth-O-Meter)

More sites:
* NYTimes, example 2016 US Elections
* factcheck.org, example, give bite-sized TLDRs and longer groundings
* Google will reportedly launch truthness icons on search results
(http://www.politifact.com, example Trump's Truth-O-Meter)
More sites:
* NYTimes, example 2016 US Elections
* factcheck.org, example, give bite-sized TLDRs and longer groundings
* Google will reportedly launch truthness icons on search results

¶ Subjective Time
The American Time Use Survey is an ongoing program from the Bureau of Labor Statistics that asks thousands of people, what they did during the last 24 hours. See @.

The American Time Use Survey is an ongoing program from the Bureau of Labor Statistics that asks thousands of people, what they did during the last 24 hours. See @.
¶ Change dynamics
* Ed Hawkins, Climate spirals (Global warming: Temperature + Time)
See:
* Reproduced in Wolfram: http://community.wolfram.com/groups/-/m/t/859046
* Updates: http://www.climate-lab-book.ac.uk/spirals/
* Wipneus, Global Sea Ice Area (NSIDC data)
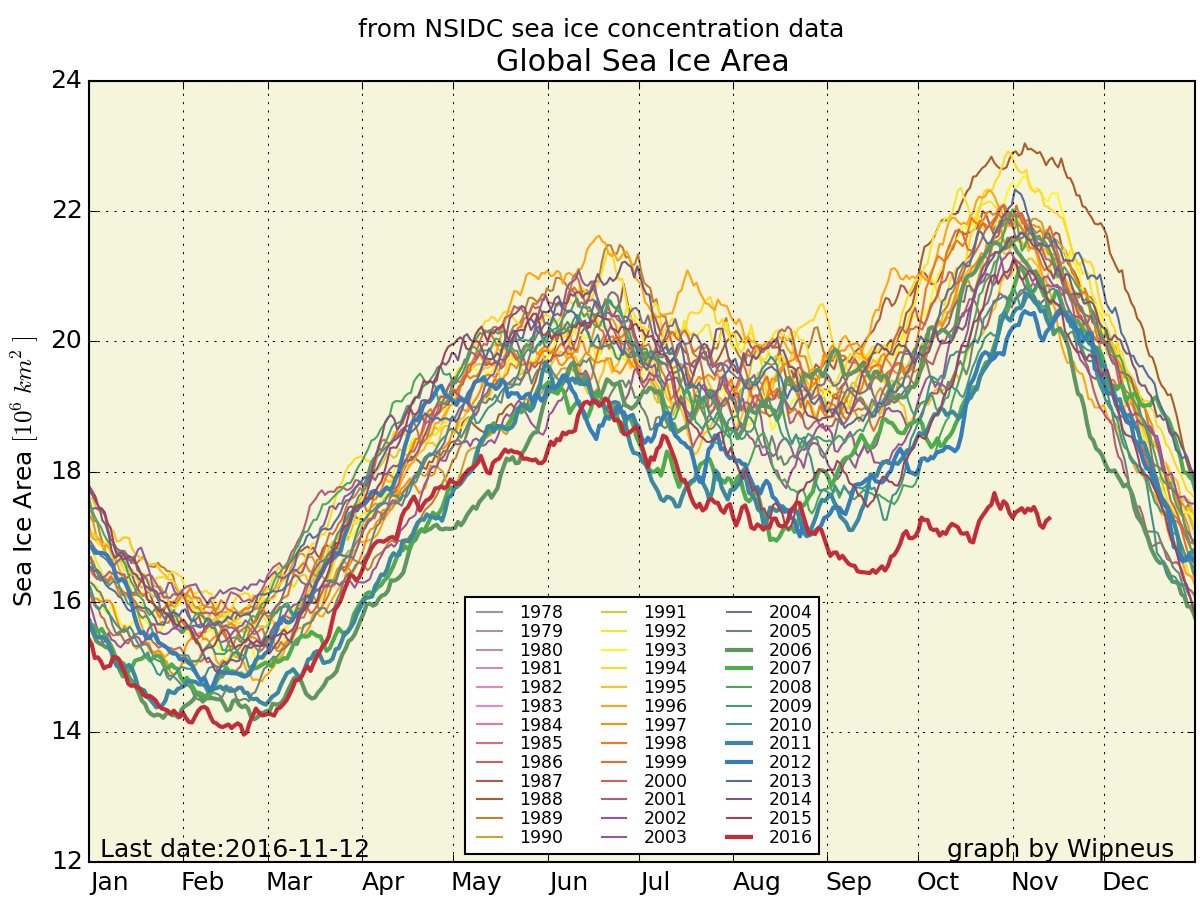
See:
* http://sites.google.com/site/arctischepinguin/home/piomas
* http://www.wunderground.com/blog/JeffMasters/crazy-cryosphere-record-low-sea-ice-an-overheated-arctic-and-a-snow
* https://www.bbc.com/news/science-environment-45653099
* Ed Hawkins, Climate spirals (Global warming: Temperature + Time)
See:
* Reproduced in Wolfram: http://community.wolfram.com/groups/-/m/t/859046
* Updates: http://www.climate-lab-book.ac.uk/spirals/
* Wipneus, Global Sea Ice Area (NSIDC data)
See:
* http://sites.google.com/site/arctischepinguin/home/piomas
* http://www.wunderground.com/blog/JeffMasters/crazy-cryosphere-record-low-sea-ice-an-overheated-arctic-and-a-snow
* https://www.bbc.com/news/science-environment-45653099
¶ * curated tactical maps
* Hours of Daylight on the Summer Solstice in the Northern Hemisphere
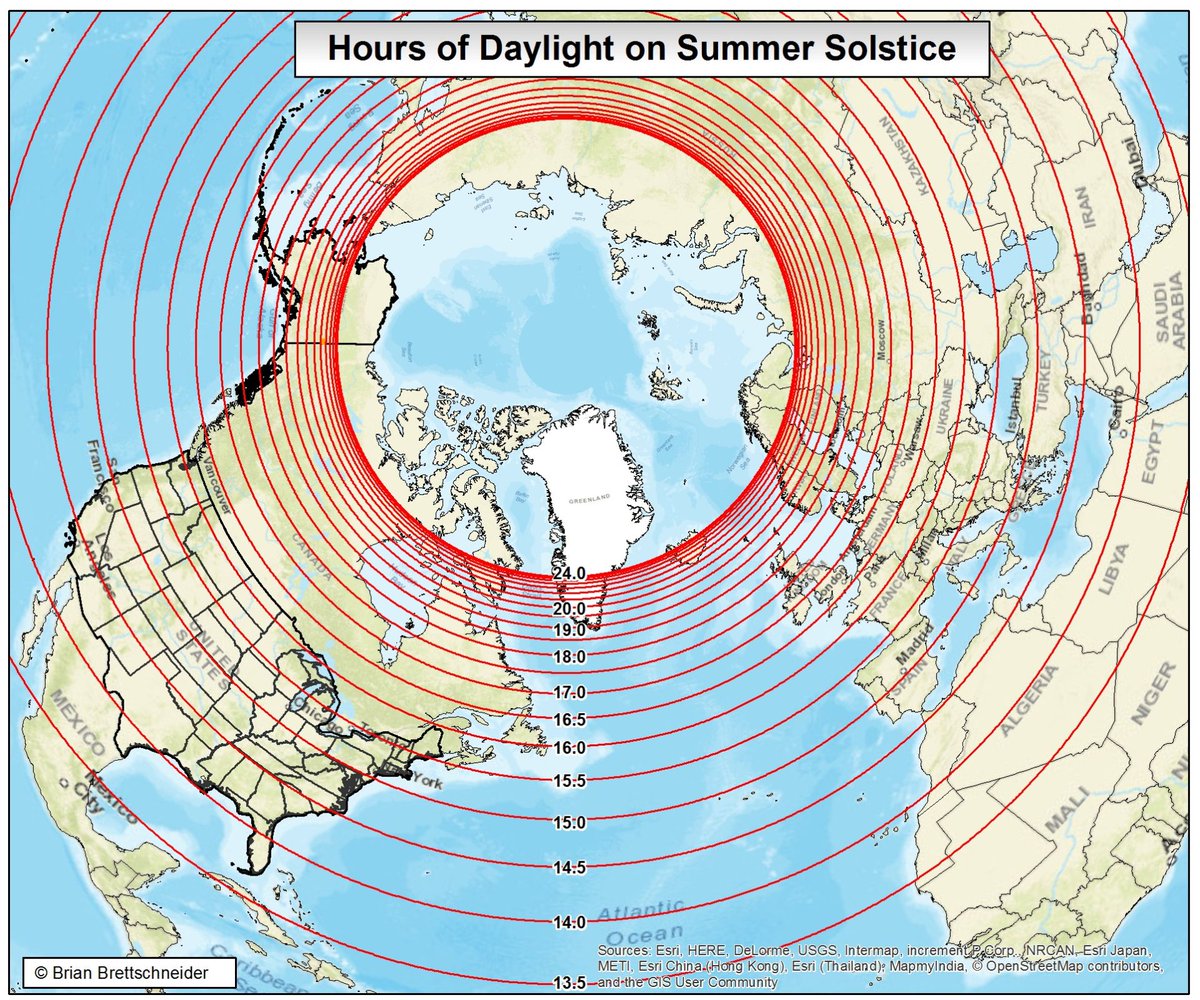
( via http://twitter.com/Amazing_Maps/status/797899363477426176 )
* Deforming maps based on statistics:
( via: http://metrocosm.com/map-us-economy/ )
( tool: http://scapetoad.choros.ch/ )
* Hours of Daylight on the Summer Solstice in the Northern Hemisphere
( via http://twitter.com/Amazing_Maps/status/797899363477426176 )
* Deforming maps based on statistics:
( via: http://metrocosm.com/map-us-economy/ )
( tool: http://scapetoad.choros.ch/ )
¶ * capitalist economics
essentials to a possibility of such a system
* Stock pages:
(and, as Marko Pogačnik / OHO, "thing as itself / embodying itself" ... not as "representation", but "embodiement")
* Candlestick charts:
* Patterns:
https://en.wikipedia.org/wiki/Candlestick_pattern
#astrology
* Timezone ...:
* UTC if not noted otherwise ?
* (Would be great to see "most important" ticks noted - "Chinese wake up", etc)
* "Why don't opens and closes connect"
* [...]
* Bloomberg Terminals
* [...]
¶ * videos (youtube, etc)
* population graphs : https://www.youtube.com/watch?v=DqKg5rWLpEo (density, distribution, age structure, growth rate, mortality/fertility, demographic transitions, future prediction...)
* [...]
* population graphs : https://www.youtube.com/watch?v=DqKg5rWLpEo (density, distribution, age structure, growth rate, mortality/fertility, demographic transitions, future prediction...)
* [...]
¶_________________
* (simple) illustrations / motion graphics
* ###
<------------------ (new) TYPES ↑↑↑
* (simple) illustrations / motion graphics
* ###
¶ * Visual vocabulary:
!!!
data/relation type to appropriate visualization types
http://ft-interactive.github.io/visual-vocabulary/
!!!
data/relation type to appropriate visualization types
http://ft-interactive.github.io/visual-vocabulary/
¶ * (#hypertheory #philosophy) A Map of Hegel's Science of Logic
http://autio.github.io/projects/scienceoflogic/
http://autio.github.io/projects/scienceoflogic/
¶ * "The Philosopher’s Web," Influences Connecting Ancient & Modern Philosophers
http://www.openculture.com/2017/10/the-philosophers-web.html
http://www.openculture.com/2017/10/the-philosophers-web.html
¶ * (#topology #compsci) Neural Network Zoo
http://www.asimovinstitute.org/neural-network-zoo/
"""
With new neural network architectures popping up every now and then, it’s hard to keep track of them all. Knowing all the abbreviations being thrown around (DCIGN, BiLSTM, DCGAN, anyone?) can be a bit overwhelming at first.
So I decided to compose a cheat sheet containing many of those architectures. Most of these are neural networks, some are completely different beasts. Though all of these architectures are presented as novel and unique, when I drew the node structures… their underlying relations started to make more sense.
"""
¶ * Gallery of Concept Visualizations:
UPDATE 2020-10-29 : SEEMS DOWN?
http://conceptviz.github.io/ !!!
#LoL
STILL MENTIONED HERE:
https://www.informationisbeautifulawards.com/showcase/865-gallery-of-concept-visualization
UPDATE 2020-10-29 : SEEMS DOWN?
http://conceptviz.github.io/ !!!
STILL MENTIONED HERE:
https://www.informationisbeautifulawards.com/showcase/865-gallery-of-concept-visualization
¶ * Visual intriduction to probability and statistics
http://students.brown.edu/seeing-theory/index.html !!!
http://students.brown.edu/seeing-theory/index.html !!!
¶ * Graphs, maps, plots, ... of import/export by country
http://atlas.media.mit.edu/en/visualize/network/hs92/export/usa/all/show/2016/ !!!
http://atlas.media.mit.edu/en/visualize/network/hs92/export/usa/all/show/2016/ !!!
¶ * Big Data+ML for social networks of the past:
@Time Machine Venice
https://www.nature.com/news/the-time-machine-reconstructing-ancient-venice-s-social-networks-1.22147
@Time Machine Venice
https://www.nature.com/news/the-time-machine-reconstructing-ancient-venice-s-social-networks-1.22147
¶ * (large scale sat image auto-analysis → archaeology)
* Large-scale method to identify ancient human settlements and their connections with satellites
https://www.nature.com/news/satellites-expose-8-000-years-of-civilization-1.10257
"""
To sift through satellite images for those signatures, co-author Bjoern Menze, a research affiliate in computer science at the Massachusetts Institute of Technology in Cambridge, built on his skills from his day job identifying tumours in clinical images.
Menze trained software to detect the characteristic wavelengths of known anthrosols in images spanning 50 years of seasonal differences. This automation was key. “You could do this with the naked eye using Google Earth to look for sites, but this method takes the subjectivity out of it by defining spectral characteristics that bounce off of archaeological sites,” says Ur.
"""
¶ * vikusviewer: "Explore cultural collections along time, texture and themes
* https://vikusviewer.fh-potsdam.de/ !!!
* https://vikusviewer.fh-potsdam.de/ !!!
¶ * (evolution of symbolic cognition)
"""
I suspect you will greatly enjoy Pavlenko's book "The Bilingual Mind: and what it tells us about language and thought" http://hypotext.co/resources
"e.g. What makes human language more powerful than "the communications of chimps"? This table outlines the evolution of symbolic cognition, e.g. "mental time travel." The book then discusses the debate on how language development might influence cognitive development & vice versa" <
"""
via https://twitter.com/hypotext/status/995118222834831360 :
via http://hypotext.co/ / Katherine Ye
via http://hypotext.co/
"""
I suspect you will greatly enjoy Pavlenko's book "The Bilingual Mind: and what it tells us about language and thought" http://hypotext.co/resources
"e.g. What makes human language more powerful than "the communications of chimps"? This table outlines the evolution of symbolic cognition, e.g. "mental time travel." The book then discusses the debate on how language development might influence cognitive development & vice versa" <
"""
via https://twitter.com/hypotext/status/995118222834831360 :
via http://hypotext.co/ / Katherine Ye
via http://hypotext.co/
¶ * Dynamicland: IRL computational medium
https://dynamicland.org/ @oakland
#learning #teaching
"""
We are inventing a new computational
medium where people work together
with real objects in the real world, not
alone with virtual objects on screens.
"""
#hyperspaces
Bret Victor / @worrydream
https://dynamicland.org/ @oakland
#learning #teaching
"""
We are inventing a new computational
medium where people work together
with real objects in the real world, not
alone with virtual objects on screens.
"""
#hyperspaces
Bret Victor / @worrydream
¶ * (#scarcity) "These images have same pixels as number of members of the species"
* https://twitter.com/manojlds/status/1027921913765539840 :
These images have same pixels as number of members of the species.
Good job @WWF
show number of surviving members of species by pixels ...
(Effective display of 10^3-6 set cardinality)
* https://twitter.com/manojlds/status/1027921913765539840 :
These images have same pixels as number of members of the species.
Good job @WWF
show number of surviving members of species by pixels ...
(Effective display of 10^3-6 set cardinality)
¶ * (#subflow) language to (en)code real-life behaviour
* https://github.com/jxe/ceml :
similar to:
#psychogeography
#subflow
🔗reference-days
[...]
<joe.edelman
* https://github.com/jxe/ceml :
similar to:
#psychogeography
#subflow
🔗reference-days
[...]
<joe.edelman
¶ * time & space history of the squatting movement
SQEK / "movokeur" collaborative research map
* https://notanatlas.org/maps/mapping-the-squatting-movement
* https://maps.squat.net/en/cities
* https://movokeur.wordpress.com/
#activism #history
SQEK / "movokeur" collaborative research map
* https://notanatlas.org/maps/mapping-the-squatting-movement
* https://maps.squat.net/en/cities
* https://movokeur.wordpress.com/
#activism #history
¶ * web corpus/mapping work: Diasporas Atlas
"Diasporas Atlas aim at mapping and analysing the occupation of the Web by diasporas""
http://www.e-diasporas.fr/
!!!
"Diasporas Atlas aim at mapping and analysing the occupation of the Web by diasporas""
http://www.e-diasporas.fr/
!!!
¶ * energetics: "The power switch: tracking Britain's record coal-free run"
* https://www.theguardian.com/environment/ng-interactive/2019/may/25/the-power-switch-tracking-britains-record-coal-free-run :
Britain has set a new record for going without coal-powered energy, but how long will it last and when will we ditch the dirty fuel entirely?
* https://www.theguardian.com/environment/ng-interactive/2019/may/25/the-power-switch-tracking-britains-record-coal-free-run :
Britain has set a new record for going without coal-powered energy, but how long will it last and when will we ditch the dirty fuel entirely?
¶ * graphical notation for lambda calculus:
http://dkeenan.com/Lambda/ :
To Dissect a Mockingbird: A Graphical Notation for the Lambda Calculus with Animated Reduction
(1996)
http://dkeenan.com/Lambda/ :
To Dissect a Mockingbird: A Graphical Notation for the Lambda Calculus with Animated Reduction
(1996)
¶ * ourworldindata:
https://ourworldindata.org/ :
"Research and data to make progress against the world’s largest problems" !!!!
----------------
* https://ourworldindata.org/grapher/covid-confirmed-cases-since-100th-case
* https://ourworldindata.org/coronavirus/country/netherlands?country=~NLD
* [...]
https://ourworldindata.org/ :
"Research and data to make progress against the world’s largest problems" !!!!
----------------
* https://ourworldindata.org/grapher/covid-confirmed-cases-since-100th-case
* https://ourworldindata.org/coronavirus/country/netherlands?country=~NLD
* [...]
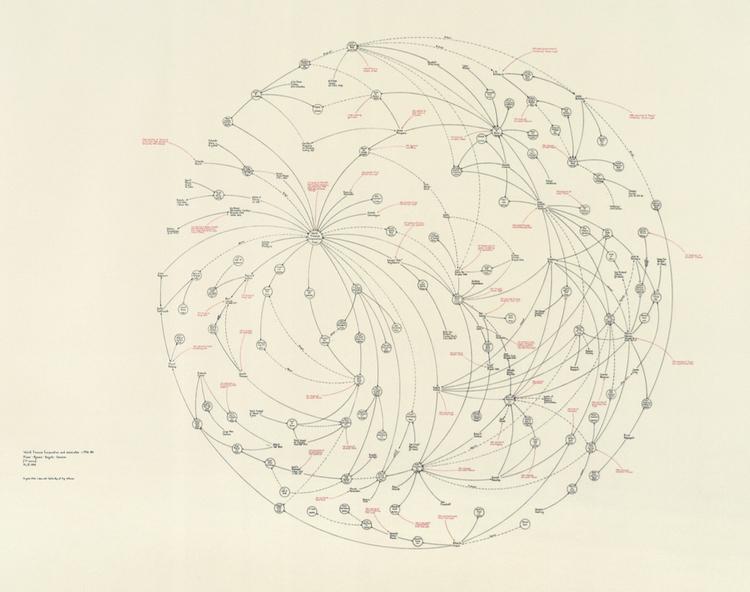
¶ * Complex Network and Map of Western Thought → Emergence of the Transnational Managerial Class Ideology
https://graphcommons.com/graphs/64d91469-5f7d-4dba-9204-c8574945948c :
"""
Emergence of the Transnational Managerial Class Ideology
By Orsan Senalp
Tektology is a comprehensive methodology. Upgrading Dialectic and Historical Materialism of Marx and Engels, with Energetism of Mach and Ostwald, it was founded by Lenin’s most important challenger Alexander Bogdanov Malinowski, between the late 1890s and 1920s. It was developed as a radical critic of Taylor’s Scientific Management yet beyond that in order to look at the entire universe and all its properties from an ‘organizational’ and ‘class’ points of view; in order to discover and study common / general patterns and mechanisms in the emergence, transformation, evolution, and demise of all complex elements and systems forming human experience, and rebuilt it in an emancipatory way. Although it is recognized as the forerunner of the modern Cybernetics of Norbert Wiener, and the General Systems Theory of Ludwig von Bertalanffy, some claims that Tektology was going further then the two and foreseeing many later discoveries made in these latter fields, following the developments in the 20th century.
"""
¶ * loopy: a simple systems sim/game
https://ncase.me/loopy
----------
part of explorables:
https://explorabl.es/
https://twitter.com/explorables
---------------------
points to D.Meadows book:
https://www.amazon.com/Thinking-Systems-Donella-H-Meadows/dp/1603580557
https://ncase.me/loopy
----------
part of explorables:
https://explorabl.es/
https://twitter.com/explorables
---------------------
points to D.Meadows book:
https://www.amazon.com/Thinking-Systems-Donella-H-Meadows/dp/1603580557
¶ * wtfhappenedin1971:
https://wtfhappenedin1971.com/ :
a collection and co-position of a bunch of peculiar charts
offered without an explanation
### !!! ... attempts linked → comments
https://wtfhappenedin1971.com/ :
a collection and co-position of a bunch of peculiar charts
offered without an explanation
¶ * simpliying economic models
https://twitter.com/leashless/status/1321476071766806529
"This should be a (very slow) animated gif of a 17 year old model of the economy that I built to explain the circular economy.":
natural capital, financial capital, waste, by-products, consumption, production
<vinay.gupta originally a 2003 slide
¶ * "A web version of the off-axis projection effect"
#3D #threejs
(nice quick demo)
https://twitter.com/mlperego/status/1288390922716295169
#3D #threejs
(nice quick demo)
https://twitter.com/mlperego/status/1288390922716295169
¶ * "Notational compendium" : history of notation systems
### #toread !!!
https://github.com/prathyvsh/notation
https://github.com/prathyvsh/notation
¶ * global energy flow & greenhouse gas emissions
https://www.wri.org/resources/charts-graphs/us-greenhouse-gas-emissions-flow-chart
https://www.sciencedirect.com/science/article/abs/pii/S0301421509006429 (2010)
uses https://en.wikipedia.org/wiki/Sankey_diagram (=flow rate!)
http://www.sankey-diagrams.com/tag/ghg/
http://www.sankey-diagrams.com/world-ghg-emissions-2012/
Fuel → Sector → gas
http://www.sankey-diagrams.com/global-energy-flows-2018-2050-dnvgl/
... updated !
https://www.wri.org/resources/data-visualizations/world-greenhouse-gas-emissions-2016
Sector → end use → gas
___________
https://www.researchgate.net/publication/46496187_The_efficient_use_of_energy_Tracing_the_global_flow_of_energy_from_fuel_to_service (2010)
(paywall)
The efficient use of energy: Tracing the global flow of energy from fuel to service
¶ * a representation (media) thought as (outcome) domains and co-domains
https://en.wikipedia.org/wiki/Function_(mathematics)
(aka SLO: "definicijsko območje" & "zaloga vrednosti")
https://en.wikipedia.org/wiki/Function_(mathematics)
¶ * Cross-Comparison as Reality check
https://i.redd.it/0kvz7p5l1f131.png (cause of death VS media reporting)
via https://ourworldindata.org/
ties to #postmedia !!!
https://i.redd.it/0kvz7p5l1f131.png (cause of death VS media reporting)
via https://ourworldindata.org/
ties to #postmedia !!!
¶ * P2P Etnography
"""
P2P Ethnography, can be defined as a qualitative research design aimed at exploring cultural phenomena. Different from Ethnography, its aim is not to produce field studies or case reports, but to establish continuously available, accessible, participatory, performative and collaborative processes which allow gaining understandings about the knowledge and the systems of meanings in the lives of a social group, and its interactions with other ones.
"""
https://wiki.p2pfoundation.net/P2P_Ethnography
and
http://www.artisopensource.net/2014/07/30/communication-knowledge-and-information-in-the-human-ecosystem-p2p-ethnography/
"""
P2P Ethnography, can be defined as a qualitative research design aimed at exploring cultural phenomena. Different from Ethnography, its aim is not to produce field studies or case reports, but to establish continuously available, accessible, participatory, performative and collaborative processes which allow gaining understandings about the knowledge and the systems of meanings in the lives of a social group, and its interactions with other ones.
"""
https://wiki.p2pfoundation.net/P2P_Ethnography
and
http://www.artisopensource.net/2014/07/30/communication-knowledge-and-information-in-the-human-ecosystem-p2p-ethnography/
¶ * printing graphs
<L> expo idea
* ... on transparent paper
in layers
so that the different steps / patterns / meaning layers can be added step by step
* See also this publication I made for an exhibitions:
https://eliesdl.cargo.site/Views-from-above-1
<L> expo idea
* ... on transparent paper
in layers
so that the different steps / patterns / meaning layers can be added step by step
* See also this publication I made for an exhibitions:
https://eliesdl.cargo.site/Views-from-above-1
¶ * "SOS": Decision Making tool / syntax / graph network viewer
(2020/10: alpha version)
"SOS is a Decision Making tool, a syntax, a graph network viewer and an XML file format."
https://sos.untiednations.com/
"""
SOS is a tool for groups to establish Issues, explore the Causes and Effects of any Issue and debate on how to deal with these Issues. Group members can then make Proposals on which the Group can act, not just to deal with the symptoms (Effects) but to deal with the root Causes. Groups can also export a data file of explorations and discussions so that other groups dealing with similar or related Issues can learn from another's efforts. Later versions of SOS will have an import feature to combine Skeins.
"""
https://sos.untiednations.com/About
a wealth of decision representation & making directions !!!
### manual
(2020/10: alpha version)
"SOS is a Decision Making tool, a syntax, a graph network viewer and an XML file format."
https://sos.untiednations.com/
"""
SOS is a tool for groups to establish Issues, explore the Causes and Effects of any Issue and debate on how to deal with these Issues. Group members can then make Proposals on which the Group can act, not just to deal with the symptoms (Effects) but to deal with the root Causes. Groups can also export a data file of explorations and discussions so that other groups dealing with similar or related Issues can learn from another's efforts. Later versions of SOS will have an import feature to combine Skeins.
"""
https://sos.untiednations.com/About
a wealth of decision representation & making directions !!!
¶ * effective long-scroll, big number perspective (USA incarceration)
https://mkorostoff.github.io/incarceration-in-real-numbers
https://mkorostoff.github.io/incarceration-in-real-numbers
¶ * Kurzgesagt (simple illustrations @ youtube channel)
https://en.wikipedia.org/wiki/Kurzgesagt
https://www.youtube.com/channel/UCsXVk37bltHxD1rDPwtNM8Q
example: on 🔗nuclear topic:
https://www.youtube.com/watch?v=Jzfpyo-q-RM
https://en.wikipedia.org/wiki/Kurzgesagt
https://www.youtube.com/channel/UCsXVk37bltHxD1rDPwtNM8Q
example: on 🔗nuclear topic:
https://www.youtube.com/watch?v=Jzfpyo-q-RM
¶ * Music flowcharts
https://4chanmusic.fandom.com/wiki/Flowcharts
" The flowcharts on this page are designed to give you a predetermined path through an artist's discography, allowing to start at one album and then progress to the next album that would suit you best. "
https://4chanmusic.fandom.com/wiki/Flowcharts
" The flowcharts on this page are designed to give you a predetermined path through an artist's discography, allowing to start at one album and then progress to the next album that would suit you best. "
¶ * Political explainer videos: Gravel Institute vs Prager U
https://twitter.com/GravelInstitute/status/1310633185198440451
https://twitter.com/GravelInstitute/status/1310633185198440451
¶ * Diagramming: Petri Nets
### <statebox , 20211130
https://en.wikipedia.org/wiki/Petri_net
"""
A Petri net, also known as a place/transition (PT) net, is one of several mathematical modeling languages for the description of distributed systems. It is a class of discrete event dynamic system. A Petri net is a directed bipartite graph that has two types of elements, places and transitions, depicted as white circles and rectangles, respectively. A place can contain any number of tokens, depicted as black circles. A transition is enabled if all places connected to it as inputs contain at least one token. Some sources[1] state that Petri nets were invented in August 1939 by Carl Adam Petri—at the age of 13—for the purpose of describing chemical processes.
Like industry standards such as UML activity diagrams, Business Process Model and Notation and event-driven process chains, Petri nets offer a graphical notation for stepwise processes that include choice, iteration, and concurrent execution. Unlike these standards, Petri nets have an exact mathematical definition of their execution semantics, with a well-developed mathematical theory for process analysis[citation needed].
"""
¶ * NATO military symbolic system / notation
https://en.wikipedia.org/wiki/NATO_Joint_Military_Symbology#Affiliation
https://en.wikipedia.org/wiki/NATO_Joint_Military_Symbology#Affiliation
¶ * Permutation notation
https://en.wikiversity.org/wiki/Permutation_notation
<---------------------- (new)+ sites/techniques/media/systems
https://en.wikiversity.org/wiki/Permutation_notation
¶*** REFERENCES
* wolfram alpha & blog
https://blog.wolfram.com/
* Visualisation & investigation by Tactical Tech
http://twitter.com/seeingsideways
* Share Lab
http://twitter.com/ShareDataLab
http://labs.rs/en/
* ###
<---------------------- (new) references ↑
* wolfram alpha & blog
https://blog.wolfram.com/
* Visualisation & investigation by Tactical Tech
http://twitter.com/seeingsideways
* Share Lab
http://twitter.com/ShareDataLab
http://labs.rs/en/
* ###
<---------------------- (new) references ↑
¶*** FUTURE WORK
Direction:
* construct reading list, akin to 🔗commonground
* FAQ
* find associates → info@totalism.org
* [...]
Research topics:
* linkroute <> representation.systems ?
* #comphermeneutics ?
* persuasion?, marketing?, propaganda?, #polemics, [...]
* "attention economy"
* [...]
Direction:
* construct reading list, akin to 🔗commonground
* FAQ
* find associates → info@totalism.org
* [...]
Research topics:
* linkroute <> representation.systems ?
* #comphermeneutics ?
* persuasion?, marketing?, propaganda?, #polemics, [...]
* "attention economy"
* [...]