hypermedia
lifestyle representation
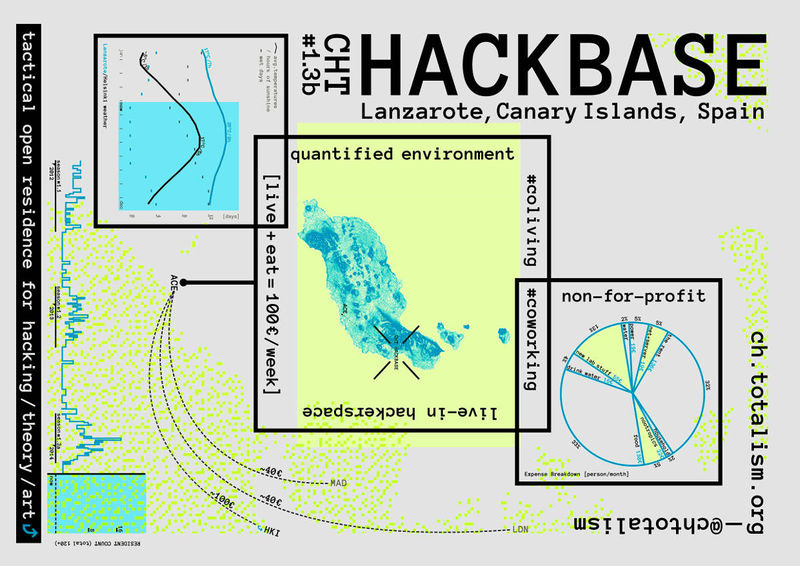
POSTER
< RFC+ >
As part of 🔗metrics project.
Last updated:
2013-04 v1.0 @helsinki
2016-11-30 redo
2020-11-08 (moving over + ping)
Ties to:
* 🔗metrics
* 🔗land-attributes (especially "Site Survey"):
* 🔗pr - presentation→representation
* 🔗representation.systems
* XXX🔗triage
* [...]
Table of Contents
| 1 | Poster v1.0 (2013) |
| 2 | What? |
| 3 | This really doesn't exist? |
| 4 | *** ATTRIBUTES / DATABOXES |
| 4.1 | DESIGNATORS |
| 4.1.1 | * Type / Class |
| 4.1.2 | * Designation (Name + Version) |
| 4.1.3 | * Mission statement |
| 4.1.4 | * Location Text + Geo-coordinate |
| 4.1.5 | * Finance type |
| 4.1.6 | * Tags / Badges / Standards |
| 4.2 | CONTEXT |
| 4.2.1 | * Map (geography) |
| 4.2.2 | * Map (topo) |
| 4.2.3 | * Travel: |
| 4.2.4 | * Climate: |
| 4.3 | METRICS (QUANTIFIED) |
| 4.3.1 | * Growth: |
| 4.3.2 | * Resource use: |
| 4.3.3 | * Residents numerics: |
| 4.3.4 | * Residents segmentation: |
| 4.3.5 | * Finance / economics: |
| 4.3.6 | * Subjective time/flow: |
| 4.4 | OTHER IDEAS |
| 4.4.1 | * environmental externalia: |
| 4.4.2 | * sovereignty: |
| 4.4.3 | * external relations: |
| 4.4.4 | * governance type |
| 4.4.5 | * psycho and socio-metrics |
| 4.5 | TODO !!! |
¶What?
Via 🔗metrics:
"A framework that enables description / representation of a lifestyle, and as a consequence,comparison between lifestyles, and as a consequence of that, switching lifestyles."
Or:
* "A medium to capture lifestyle context / topos / environment"
* [...] ###
Via 🔗metrics:
"A framework that enables description / representation of a lifestyle, and as a consequence,comparison between lifestyles, and as a consequence of that, switching lifestyles."
Or:
* "A medium to capture lifestyle context / topos / environment"
¶This really doesn't exist?
Wouldn't this be a basic ethnology / anthropology tool?
#TODO !!!
See:
* https://en.wikipedia.org/wiki/Ethnography
* "quantitative ethnology"
* https://en.wikipedia.org/wiki/Quantified_Self and "lifelogging"
* [...] ###
Maybe also:
* "visual anthropology" = via photography (?)
* https://www.palgrave.com/in/book/9783319406992
* [...]
Wouldn't this be a basic ethnology / anthropology tool?
See:
* https://en.wikipedia.org/wiki/Ethnography
* "quantitative ethnology"
* https://en.wikipedia.org/wiki/Quantified_Self and "lifelogging"
* [...] ###
Maybe also:
* "visual anthropology" = via photography (?)
* https://www.palgrave.com/in/book/9783319406992
* [...]
¶ * Growth:
* property/stuff:
* total value and coverage ("vertical scale")
* basics replication ("horizontal scale")
* knowledge:
* weight / coordinate count
* connectedness ("unmess")
* prominence / expressed interest:
* Facebook fans
* emails to contact address
* PR: conversion/acquisition/... metrics
* [...]
* property/stuff:
* knowledge:
* prominence / expressed interest:
* [...]
¶ * Resource use:
* by type (electricity, water, fossil petrol, fossil gas)
* by source (external, internal produced)
¶ * Residents numerics:
* count (linear time)
* length-of-stay stay (averages/frequency chart)
* [...]
* count (linear time)
* [...]
¶ * Residents segmentation:
* what they do (vocation, skills, interests, ...)
* who they are (personalities, ages, tastes, ...)
* "cartography of peoples' situations"
* [...]
* [...]
¶ * Finance / economics:
* external expenditures totality breakdown (Pie chart; time = cycle month)
* external expenditures weekly expoes [live+eat=100€/week]
* 🔗subeconomics perspectives and coverage (?)
* [...]
* external expenditures totality breakdown (Pie chart; time = cycle month)
* external expenditures weekly expoes [live+eat=100€/week]
* [...]
¶TODO !!!
:
* Enter values for instances:
* CHT1.3B poster
* CHT4D ("last state")
* https://next.totalism.org ("next state")
* [...]
* Support CSV->Charts on e2h:
see 🔗dev-charts
* How does this composite?:
* generative design / #postdesign
* #NOUX ?
:
* Enter values for instances:
* CHT1.3B poster
* CHT4D ("last state")
* https://next.totalism.org ("next state")
* [...]
* Support CSV->Charts on e2h:
see 🔗dev-charts
* How does this composite?:
* generative design / #postdesign
* #NOUX ?